
You don’t need data to feel it. Traffic across Phoenix and the West Valley has changed. The roads are busier, the gaps between cars are tighter, and it doesn’t take much for a routine drive to turn into something else.
But when you look at the numbers, that feeling starts to make sense. Crashes aren’t random events. They’re usually the result of small decisions, driving a little too fast, checking a phone, or assuming the other driver will stop. Most of the time, nothing happens. Until it does.
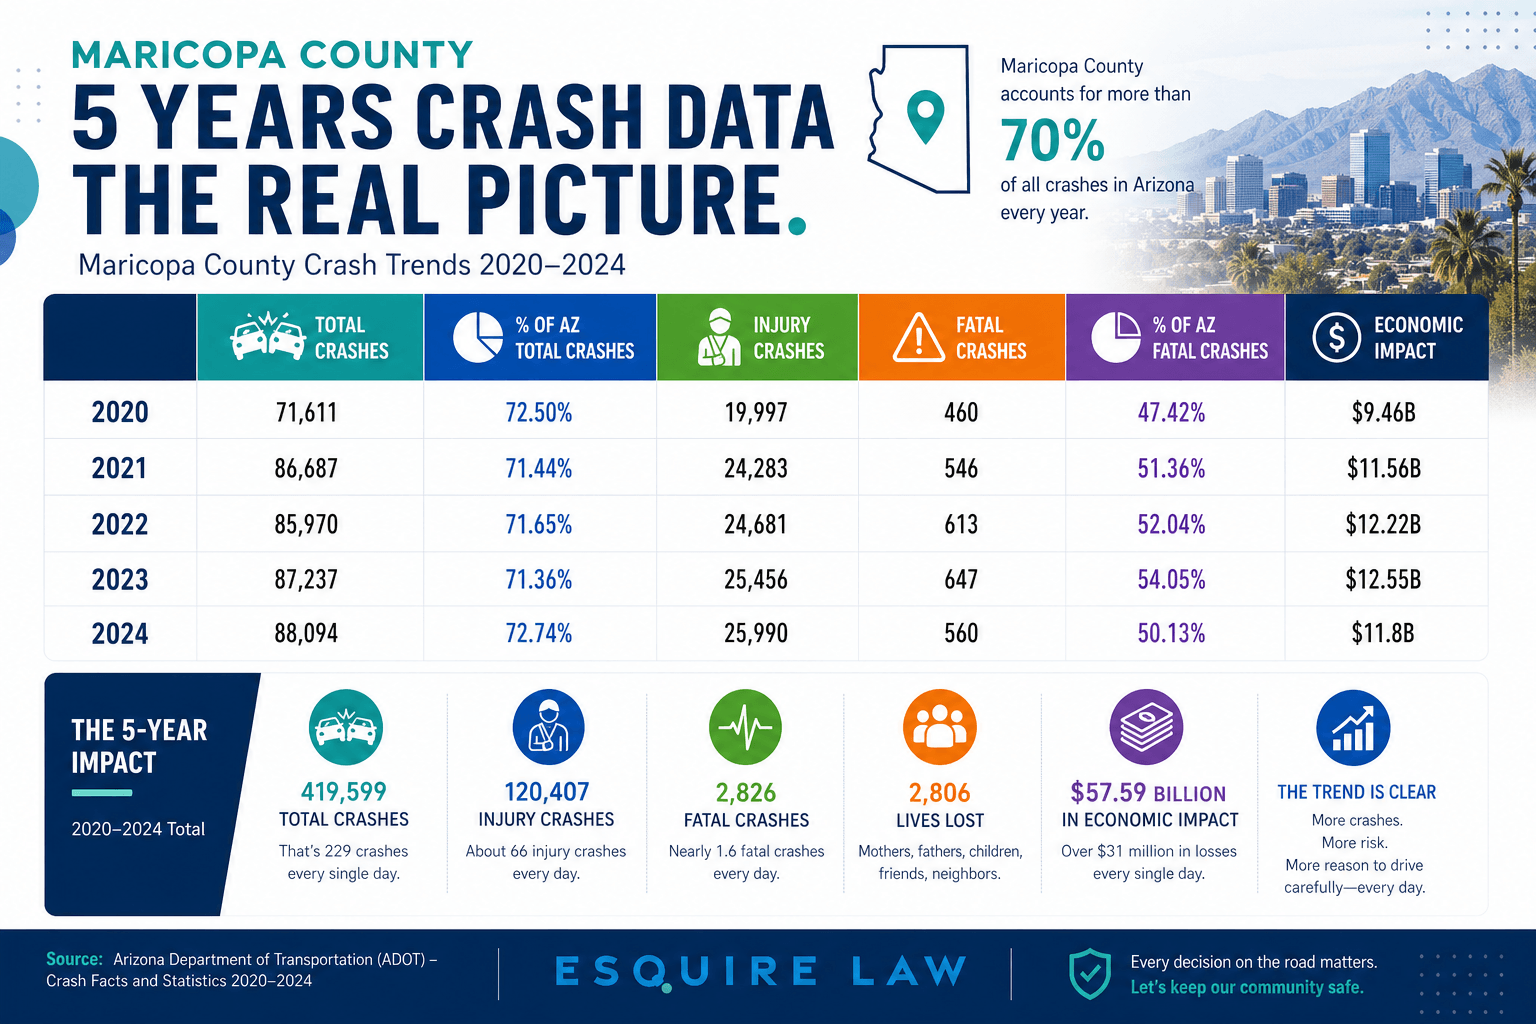
Over the past five years, Maricopa County has accounted for more than 70% of all crashes in Arizona. That’s not a short-term spike. It’s a consistent pattern.
So, at Esquire Law, we looked at the Arizona Motor Vehicle Crash Facts reports from 2020 through 2024 to understand what’s really happening on these roads, where crashes are increasing, how serious they’re becoming, and how everyday driving in places like Phoenix, Mesa, and the West Valley is changing.
Because once you step back and look at it, this isn’t just about statistics. It’s about how often crashes happen, and what they leave behind.
Maricopa County in 2024: Where Things Stand Today
Let’s start with what the most recent data actually shows because once you break it down, the scale of what’s happening on Valley roads becomes hard to ignore.
In 2024, Maricopa County recorded 88,094 total crashes. That comes out to roughly 241 crashes every single day. Out of those:
- 25,990 involved injuries
- 560 were fatal crashes
- 594 people lost their lives
On a daily level, that means that about 71 people are injured every day, and 1 to 2 people die on Maricopa County roads each day.
At the same time, the county accounts for 72.74% of all crashes in Arizona. So when we talk about crash risk in this state, we’re really talking about what’s happening right here in the Phoenix metro area.
Fatal crashes make up a small percentage overall, but that doesn’t make the rest of these incidents minor.
Injuries: Where Most Cases Actually Live
Just under 1 in 3 crashes involves an injury, which translates to over 25,000 injury crashes in a single year.
In practice, these aren’t always the crashes people expect. Most of the cases we see come from everyday situations like rear-end collisions in stop-and-go traffic, intersection crashes where someone misjudges a light or turn, routine commutes that take a wrong turn in a split second.
These aren’t dramatic highway collisions. But they still leave people dealing with pain and expenses.
Economic Impact: What These Crashes Really Cost
In 2024 alone, crashes in Maricopa County resulted in $11.8 billion in total economic loss. Spread across the year, that’s over $32 million in crash-related losses every day. Most of that cost is tied to injury and fatal crashes. Property damage cases add up, but the real financial impact comes when someone is hurt because of medical care, lost income, and long-term recovery.
Where Crashes Are Happening Across the Valley
Phoenix continues to lead by a wide margin, accounting for over 40% of all crashes in the county. That’s not surprising given the population and traffic density. But what’s changing is everything around it. Cities like
- Mesa
- Tempe
- Glendale
- Chandler
- Scottsdale
continue to see consistently high numbers.
At the same time, the West Valley is becoming a bigger part of the picture every year, especially in
- Goodyear
- Buckeye
- Surprise
- Peoria
These areas are growing fast. More homes, more commuters, more time spent on the road and naturally, more crashes.
Alcohol-Related Crashes: A Smaller Slice With Bigger Consequences
In 2024, there were 3,544 alcohol-related crashes in Maricopa County. Out of those, 167 were fatal crashes, leading to 180 people killed. That means alcohol is involved in only about 4% of total crashes, but close to 30% of fatal ones. It’s one of the clearest patterns in the data. These crashes are less frequent, but far more likely to turn serious or deadly.
What the Numbers Don’t Always Show
There’s another piece that doesn’t always show up cleanly in reports, which is a driver behavior. As safety experts often point out, crashes aren’t random. They’re usually the result of decisions such as speeding, distraction, fatigue, or impairment. Even something as simple as checking a phone for a second can change the outcome of a drive.
And in a place like Maricopa County, where hundreds of crashes happen every day, those small decisions add up quickly.
A 5-Year Look at Maricopa County Crashes (2020–2024)
When you step back and look at the full picture, the trend becomes clear: more crashes, shifting risk, and growing pressure across the Valley.
| Year | Total Crashes | % of AZ Total Crashes | Fatal Crashes | % of AZ Fatal Crashes | Economic Impact |
| 2020 | 71,611 | 72.50% | 460 | 47.42% | $9.46B |
| 2021 | 86,687 | 71.44% | 546 | 51.36% | $11.56B |
| 2022 | 85,970 | 71.65% | 613 | 52.04% | $12.22B |
| 2023 | 87,237 | 71.36% | 647 | 54.05% | $12.55B |
| 2024 | 88,094 | 72.74% | 560 | 50.13% | $11.8B |
2020: Fewer Cars, Fewer Crashes due to Covid-19 but Not Necessarily Safer Roads
In 2020, Maricopa County recorded 71,611 crashes, which breaks down to about 196 crashes per day. There were 460 fatal crashes, or roughly 1.3 fatal crashes per day.
This was the lowest crash volume across the five years, mainly due to the COVID-19 pandemic. With fewer drivers on the road, total collisions dropped, but that didn’t automatically make roads safer. Less congestion often meant higher speeds, which can increase the severity of certain crashes even when overall numbers are down.
2021: Traffic Returns, Crashes Jump
As traffic picked back up, so did crash numbers. Total crashes jumped to 86,687, an increase of over 15,000 crashes (+21.1%) in just one year. That comes out to about 237 crashes per day.
Injury crashes rose to 24,283 (+21.4%), and fatal crashes increased to 546 (+18.7%), or about 1.5 fatal crashes per day.
This wasn’t a subtle shift. It marked a clear return to pre-pandemic traffic levels, with more vehicles on the road and more opportunities for collisions.
2022: Growth Stabilizes, But Fatalities Continue to Rise
In 2022, total crashes held relatively steady at 85,970, a slight decrease of about 717 crashes (-0.8%) compared to 2021. On a daily level, that’s about 235 crashes per day.
But while overall crashes leveled off, severity told a different story. Injury crashes increased to 24,681 (+1.6%), and fatal crashes climbed to 613 (+12.3%), or roughly 1.7 fatal crashes per day.
This is where the data starts to reflect broader growth patterns of more commuting, more development, and more pressure on roads outside central Phoenix.
2023: Peak Severity Across the Board
In 2023, total crashes rose again to 87,237, adding about 1,267 more crashes (+1.5%) compared to the previous year. That’s nearly 239 crashes per day.
Injury crashes reached 25,456 (+3.1%), and fatal crashes peaked at 647 (+5.5%), which comes out to about 1.8 fatal crashes per day, which was the highest in this five-year span.
At the same time, economic losses hit their highest point at $12.55 billion. This wasn’t just about more crashes but also more serious ones.
2024: More Crashes, But a Drop in Fatalities
By 2024, total crashes reached their highest level at 88,094, an increase of 857 crashes (+1.0%). That’s about 241 crashes every day across Maricopa County.
Injury crashes also continued to rise, reaching 25,990 (+2.1%). But fatal crashes dropped to 560 (-13.4%), or about 1.5 fatal crashes per day, which made a noticeable shift after peaking the year before.
One likely factor is congestion. As traffic increases, average speeds tend to decrease, which can reduce the likelihood of fatal outcomes even as total crash numbers continue to climb.
What Changed Over Time and Why It Matters
When you look at the last five years together, the numbers tell a story that’s hard to ignore. From 2020 through 2024, Maricopa County saw more than 419,000 crashes. Crashes increased by more than 16,000 per year from 2020 to 2024. Daily crash volume jumped from about 196 to 241 crashes per day. That’s not a projection; that’s what actually happened on these roads in just five years.
During that same period, there were over 2,800 fatal crashes and nearly 3,000 lives lost. Fatal crashes rose steadily through 2023, then dropped in 2024. Even in the “best” year, people were still losing their lives on Valley roads every day
The financial toll is just as striking. Combined economic losses exceed $57 billion over those five years. That’s money tied to medical care, lost income, emergency response, and the long-term impact crashes leave behind.
Crashes Are Increasing And Becoming Part of Everyday Driving
In 2020, there were about 196 crashes per day. By 2024, that number climbed to 241 daily crashes.
That shift doesn’t feel dramatic until you think about what it means in real life. More cars on the road, more congestion, and more moments where something small, looking away for a second, misjudging a light, turns into a collision. Crashes aren’t rare events anymore. In a place like Phoenix, they’re part of the daily traffic flow.
The Risk Is No Longer Centered in Phoenix
Five years ago, most crashes were heavily concentrated in Phoenix. That’s still true to a degree, but it’s no longer the full picture. As the Valley has expanded, so has the risk. Cities like Goodyear, Buckeye, and Surprise have seen steady increases in crash activity. More development has brought more drivers, longer commutes, and more time spent on high-speed roads connecting these areas to the rest of the metro. For a lot of people, that means the most dangerous part of their day isn’t downtown: it’s the drive in and out.
Alcohol Remains One of the Clearest Risk Factors
Across all five years, alcohol-related crashes consistently made up a relatively small share of total collisions, which is around 4%. But when you look at fatal crashes, the picture changes. Alcohol is involved in a disproportionate number of deadly outcomes, year after year. It’s one of the few patterns in the data that doesn’t shift much. And it’s also one of the most preventable.
What This Data Means for You on the Road
Most crashes in Maricopa County don’t make the news, but they happen every single day. On familiar roads. At routine intersections. During the drive you’ve done a hundred times before.
The data shows a clear pattern: crashes are increasing, and so is the risk. It’s not just about high-speed collisions or rare events. It’s the everyday moments. A quick glance at your phone. Misjudging a yellow light. Assuming another driver will yield.
A few simple habits can make a real difference: slow down at intersections, stay focused, even on familiar routes, and keep a safe distance.
If you or someone in your family is involved in a crash, having the right legal support can make that process clearer and more manageable. When you work with us, you have a team that understands complex injury cases and knows how to protect your rights at every stage.