


Arizona ranked near the top nationally for fatal crash rates again in 2024, and alcohol-related deaths remain well above the U.S. average
Driving in Arizona has become increasingly dangerous over the last several years, and new state and national crash data shows the problem is far from improving completely.
Our team analyzed the latest national fatality rankings alongside Arizona’s newly released 2024 crash data. The findings show Arizona remained near the top nationally for fatal crash rates, while alcohol-related deaths, speeding, and severe urban crashes continued shaping deadly collisions across the state. Let’s see what data says about Arizona drivers.
For many Arizona drivers, the trends match what they already experience every day on Valley freeways and city roads: heavier traffic, more aggressive driving, higher speeds, and increasingly severe crashes.
Arizona Ranked Second Nationally for Fatality Rate in 2023
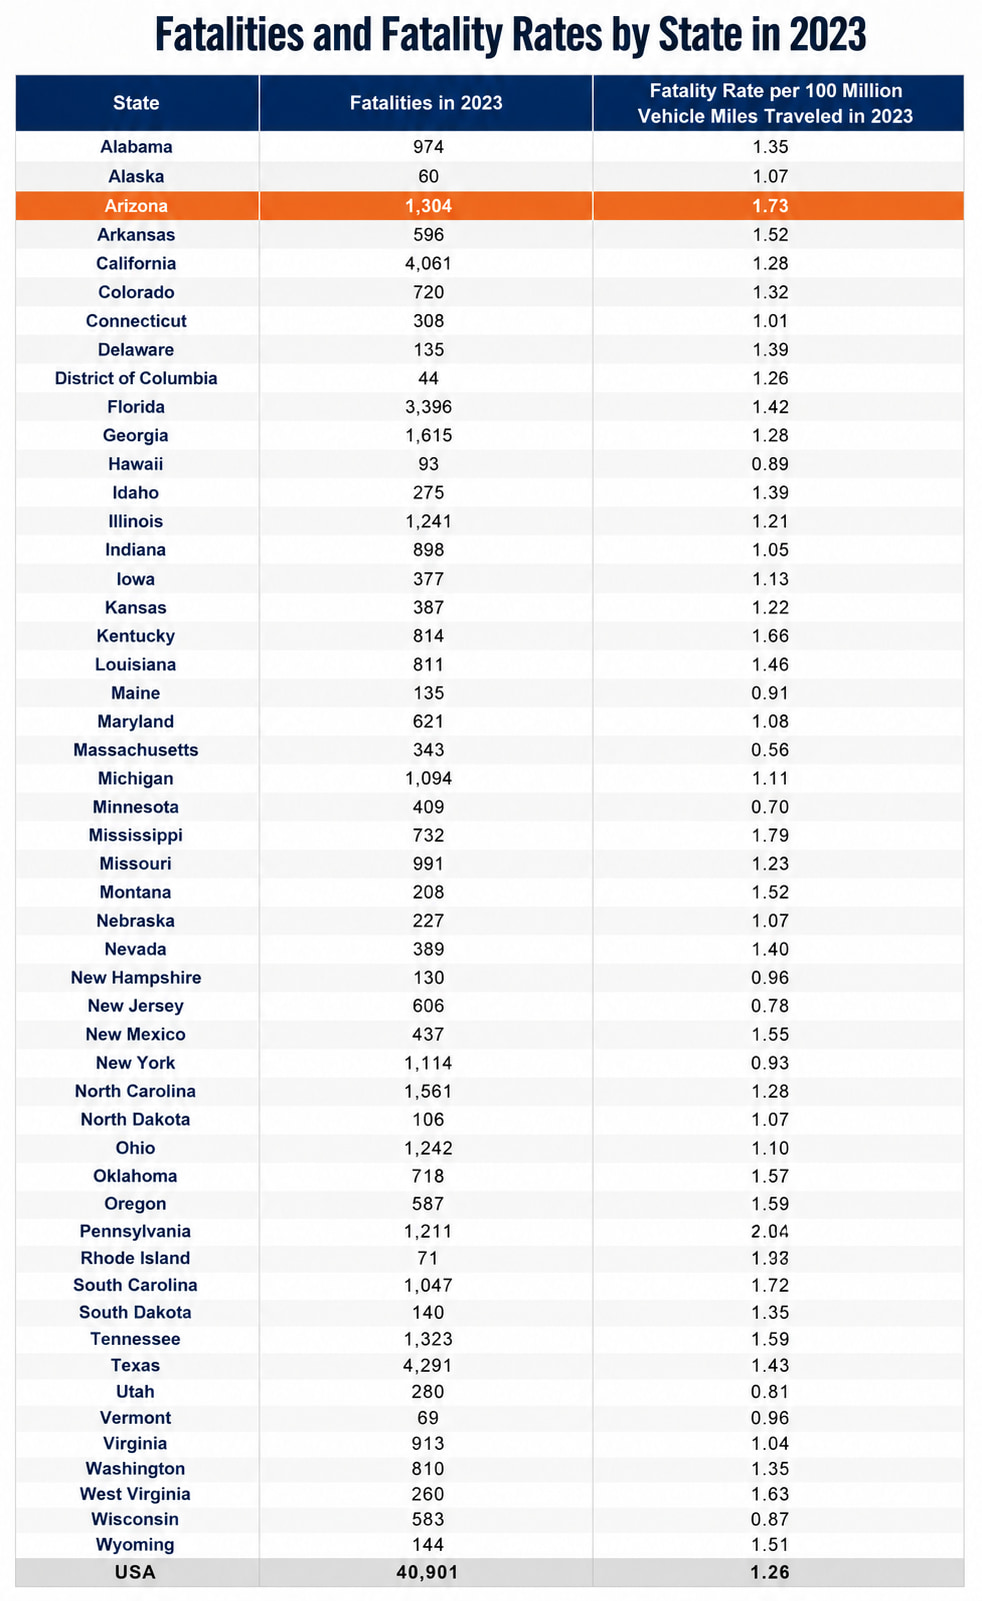
According to 2023 NHTSA traffic fatality data (from the Fatality Analysis Reporting System), Arizona recorded 1,304 traffic fatalities and a fatality rate of 1.73 deaths per 100 million vehicle miles traveled. That placed Arizona as the second highest in the country among all US states. Only Mississippi reported a higher fatality rate at 1.79. South Carolina followed closely behind Arizona at 1.72.
By comparison, the average national fatality rate was 1.26. The numbers suggest Arizona drivers faced a significantly higher risk of deadly crashes than drivers in most other states.
Arizona’s Traffic Deaths Fell in 2024 But the Fatality Rate Kept Rising
Preliminary NHTSA Traffic Safety Facts 2024 data showed overall traffic fatalities declined nationwide. Across the U.S., traffic deaths dropped from 41,025 in 2023 to 39,254 in 2024. That represented a 4.3% decrease nationally.
Arizona also recorded fewer fatalities. Statewide deaths fell from 1,308 fatalities in 2023 to 1,229 fatalities in 2024, making a decrease of 79 deaths or roughly 6.0%. Based on the AZDOT crash report, 1,228 persons were killed in 1,117 fatal crashes in 2024 (vs. 1229 persons based on National data).
Concerning the findings in the state data is that Arizona’s fatality rate continued to increase despite fewer total deaths. The fatality rate per vehicle miles traveled went up to 1.74 in 2024 based on the AZDOT crash report. As we mentioned, with 1.73 in 2023, Arizona placed in 2nd position nationally for fatalities in 2023; we’ll wait for the national fatality rate data. So we’ll see trends in other states, but while numbers went down, Arizona still ranks among the higher-risk states for fatal crashes overall.
| Year | Fatality Rate per Vehicle Miles Traveled (VMT) |
|---|---|
| 2021 | 1.62 |
| 2022 | 1.73 |
| 2023 | 1.73 |
| 2024 | 1.74 |
The statistics translate into a constant flow of serious crashes happening across the state every day.
- Approximately 3.36 people were killed every day
- One person died every 7 hours and 9 minutes
- Approximately 149 people were injured daily
- One person was injured every 9 minutes and 41 seconds
Even though fatal crashes represented less than 1% of all crashes statewide, they accounted for devastating consequences for hundreds of Arizona families.
Arizona Still Ranked High for Alcohol-Related Traffic Deaths
Impaired driving remained one of the clearest patterns throughout the state’s fatal crash data.
Arizona recorded 419 alcohol-impaired-driving fatalities in 2024. That represented approximately 34% of all traffic deaths statewide, and is higher than 33% in 2023.
The national average was 30%. Only a handful of states reported percentages as high or higher than Arizona, including South Carolina and Texas at 40%. Based on AZDOT, there were 312 Fatal Crashes and 347 persons killed (vs 419 fatalities based on National data, making 34% vs 28% per state data.)
So while total fatalities declined, alcohol-related crashes continued contributing to roughly one out of every three traffic deaths in Arizona. The 2024 Arizona crash report showed alcohol-related crashes made up only 4.56% of all crashes statewide, but accounted for nearly 28% of fatal crashes. That gap highlights how much more likely impaired-driving crashes are to become deadly.
Where Fatal Arizona Crashes Happen in 2024
The majority of traffic deaths in Arizona occurred in urban regions, especially around larger metro areas. 781 fatalities occurred in urban areas, and 447 fatalities occurred in rural areas meaining nearly 64% of all traffic deaths happened in urban areas.
The concentration is largely tied to Arizona’s largest metro regions, especially the Phoenix area, where congestion, freeway traffic, high-speed corridors, and multi-vehicle crashes are far more common.
At the same time, rural crashes often remain especially severe because of higher highway speeds and longer emergency response times.
Maricopa County Accounted for Nearly Half of Arizona Traffic Deaths
County-by-county crash data showed Maricopa County continued to account for the largest share of fatalities statewide. Counties with the highest traffic deaths in 2024:
| Month | Fatal Crashes |
|---|---|
| April | 120 |
| October | 105 |
| August | 99 |
| January | 93 |
| March | 92 |
| December | 92 |
Maricopa County alone accounted for approximately 48% of all traffic deaths statewide
Given the population size and traffic volume across Phoenix and surrounding cities, the concentration is not surprising. Still, the numbers highlight how dangerous major urban corridors remain throughout the Valley.
Causes of Fatal Crashes
Except for drunk and impaired driving, fatal-crash driver violations included:
| Violation | Drivers in Fatal Crashes |
|---|---|
| Speed Too Fast for Conditions | 152 |
| Failed to Yield Right-of-Way | 139 |
| Failed to Keep in Proper Lane | 133 |
| Drove Left of Center Line | 88 |
| Exceeded Lawful Speed | 71 |
| Disregarded Traffic Signal | 64 |
The state’s driver-violation data showed speeding-related behaviors remained among the most common factors tied to deadly crashes. Also, the data points toward many fatal crashes involving excessive speed, aggressive driving, lane departures, intersection conflicts, and loss-of-control collisions. Many of those crash patterns closely mirror the issues traffic safety officials continue raising across Phoenix-area roads and highways.
When Fatal Crashes Happened Most Often in Arizona
Arizona’s 2024 crash data shows fatal crashes were not spread evenly across the year, week, or day. Certain months and time periods saw noticeably higher deadly crash counts.
Fatal crashes peaked during spring and fall months
Fatal crashes peaked in April, with 120 fatal crashes, the highest monthly total in 2024. The next highest months were:
| Month | Fatal Crashes |
|---|---|
| April | 120 |
| October | 105 |
| August | 99 |
| January | 93 |
| March | 92 |
| December | 92 |
June and July had lower fatal crash totals, with 88 and 86 fatal crashes respectively, even though overall crash totals also dipped during early summer.
Friday Was the Deadliest Day on Arizona Roads
Fatal crashes were highest on Friday with 199 fatal accidents, followed by Saturday with 183 and Wednesday with 158 fatal crashes. So the deadliest day of the week on Arizona roads is Friday.
| Day | Fatal Crashes |
|---|---|
| Friday | 199 |
| Saturday | 183 |
| Wednesday | 158 |
| Sunday | 154 |
| Tuesday | 151 |
| Thursday | 137 |
| Monday | 135 |
Weekends were especially dangerous. Although weekend crashes accounted for 27.53% of all crashes, they made up 39.75% of fatal crashes. That suggests crashes on Saturdays and Sundays were more likely to turn deadly.
Evening Hours Were the Most Dangerous Time to Drive
Fatal crashes increased during late afternoon, evening, and nighttime hours. The most dangerous hour was 6:00 PM, with 79 fatal crashes. Other high-risk hours included:
| Hour Beginning | Fatal Crashes |
|---|---|
| 6:00 PM | 79 |
| 7:00 PM | 69 |
| 9:00 PM | 64 |
| 10:00 PM | 60 |
| 12:00 AM | 56 |
| 12:00 PM | 53 |
Overall, fatal crashes increased during late afternoon, evening, and nighttime hours, when congestion, fatigue, speeding, lower visibility, and impaired driving often overlap.
Lighting data also supports that concern. In 2024, dark conditions accounted for a large share of fatal crashes, including:
- 329 fatal crashes in dark but lighted conditions
- 177 fatal crashes in dark and not lighted conditions
- 39 fatal crashes in dark conditions with unknown lighting
So while many fatal crashes still happened during daylight, nighttime conditions remained a major risk factor across Arizona.
The Bigger Picture
But the broader trends remain difficult to ignore.
Arizona continues ranking near the top nationally for fatal crash rates. Alcohol-related deaths remain above the national average. Urban regions continue seeing the highest concentration of deadly crashes, while speeding and lane-related violations remain common factors in fatal collisions statewide.
For Arizona drivers, the data is another reminder that even routine daily commutes can quickly turn dangerous. Staying alert, avoiding aggressive driving behaviors, and making safer decisions behind the wheel can help reduce the risk of serious crashes.
And when a crash does happen because of another driver’s negligence, getting legal guidance early can make a major difference. Our Phoenix car accident lawyers at Esquire Law help injured victims and families understand their rights and pursue compensation after serious collisions across the state.